Reader,
You would have definitely heard of this concept before. It is also more commonly referred to as the “Fishbond Diagram”.
What is it?
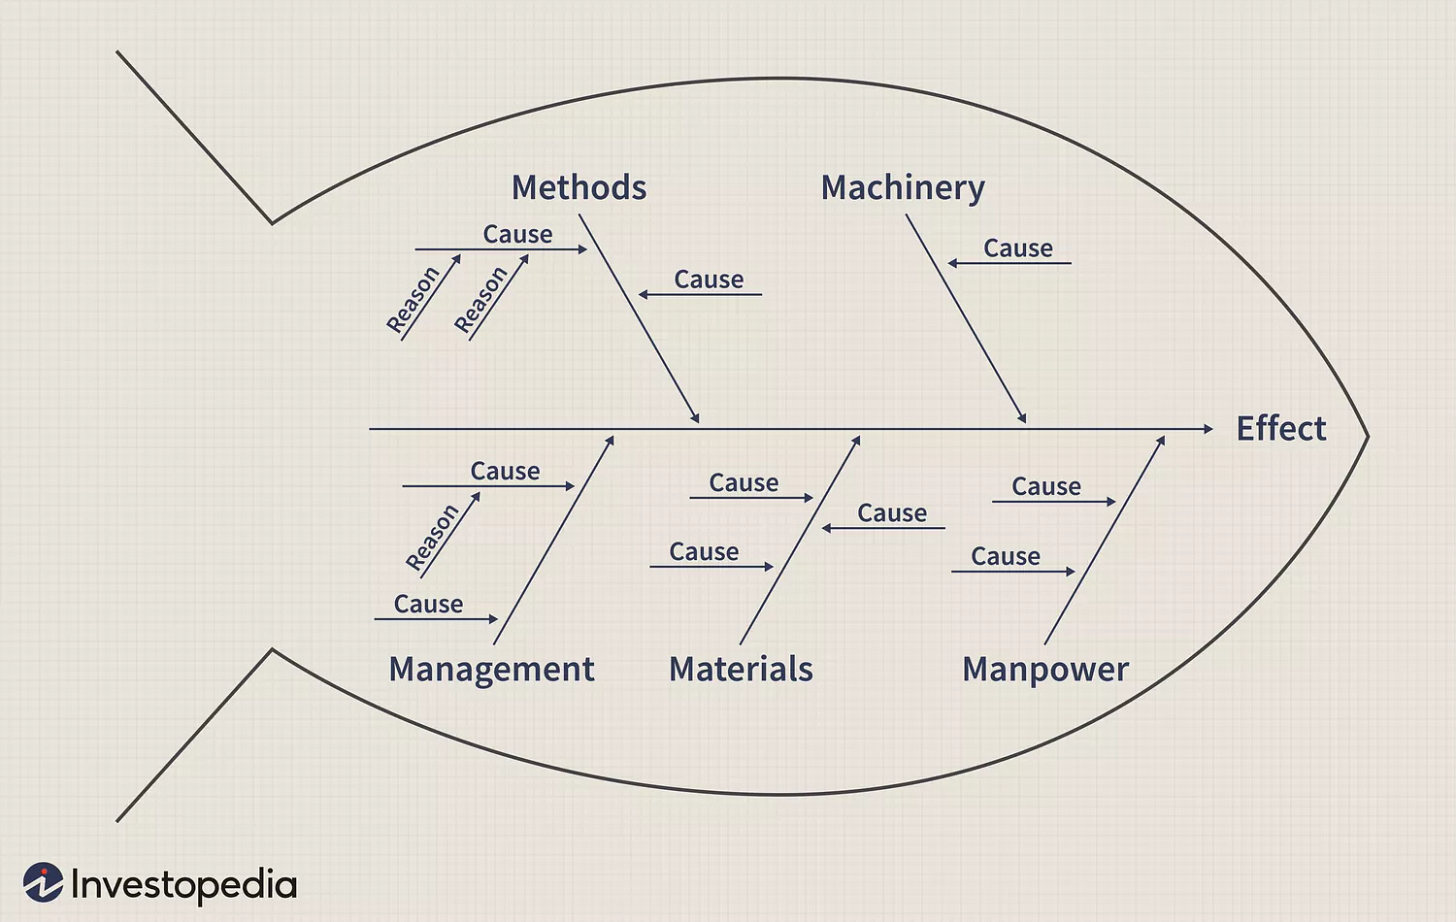
The Ishikawa diagram, also known as a Fishbone diagram due to its visual resemblance to a fish's skeleton, is a tool used in quality management to identify and analyze potential causes contributing to a particular effect or problem.

Developed by Kaoru Ishikawa, this diagram organizes causes into categories, making it easier to understand the root causes of an issue.
Imagine a scenario in a manufacturing company where there's a decline in product quality. The Fishbone diagram would visually represent this issue:
Effect: Poor Product Quality
Categories of Causes (commonly referred to as the "bones" of the fish):
Manpower: Potential causes related to the workforce, like inadequate training or lack of skills.
Methods: Causes related to the processes and methodologies employed in production.
Materials: Issues related to raw materials, their quality, or suitability for production.
Machines: Problems stemming from equipment, machinery, or technology used in production.
Environment: Factors related to the working environment, such as temperature, humidity, or workspace layout.
📣 Sponsor the Next Edition!
Showcase your amazing service or product in front of a highly-intellectual audience of 1000+ readers.
What do I need to know?
Key points about the Ishikawa/Fishbone diagram:
Visual representation: It provides a clear, visual representation of potential causes contributing to a specific problem, aiding in a structured analysis of complex issues.
Categorization of causes: By categorizing causes into groups like manpower, methods, materials, machines, and environment (often referred to as the 5Ms and 1E), it helps in systematically identifying potential root causes.
Problem-solving tool: It's an effective tool for problem-solving and quality improvement initiatives within organizations, allowing teams to brainstorm and identify potential causes collaboratively.
Sources:
https://www.investopedia.com/terms/i/ishikawa-diagram.asp
https://en.wikipedia.org/wiki/Ishikawa_diagram


